Multi Cluster Thanos Monitoring
Multi-cluster observability is a modern infra necessity. Thanos not just helps with that but it also helps with long term metric retention.

In my current workplace, we have our services deployed in multiple environments (Dev, Stage, Prod, etc.) across multiple cloud provider accounts. Some of these are Kubernetes based environments, others are simply running on EC2 and VM.
We wanted to have a single monitoring infrastructure to monitor all these different environments. We also wanted to avoid creating same dashboards and RBAC for developers in each environment separately.
Enter Thanos
We came across long term metric retention and multi-tenant support of Thanos while researching. Best part is that Thanos follows a sidecar pattern so we could just use our existing Prometheus setup in every environment without much changes.
Setup: Prometheus
For this post, we will simulate the following infra structure:
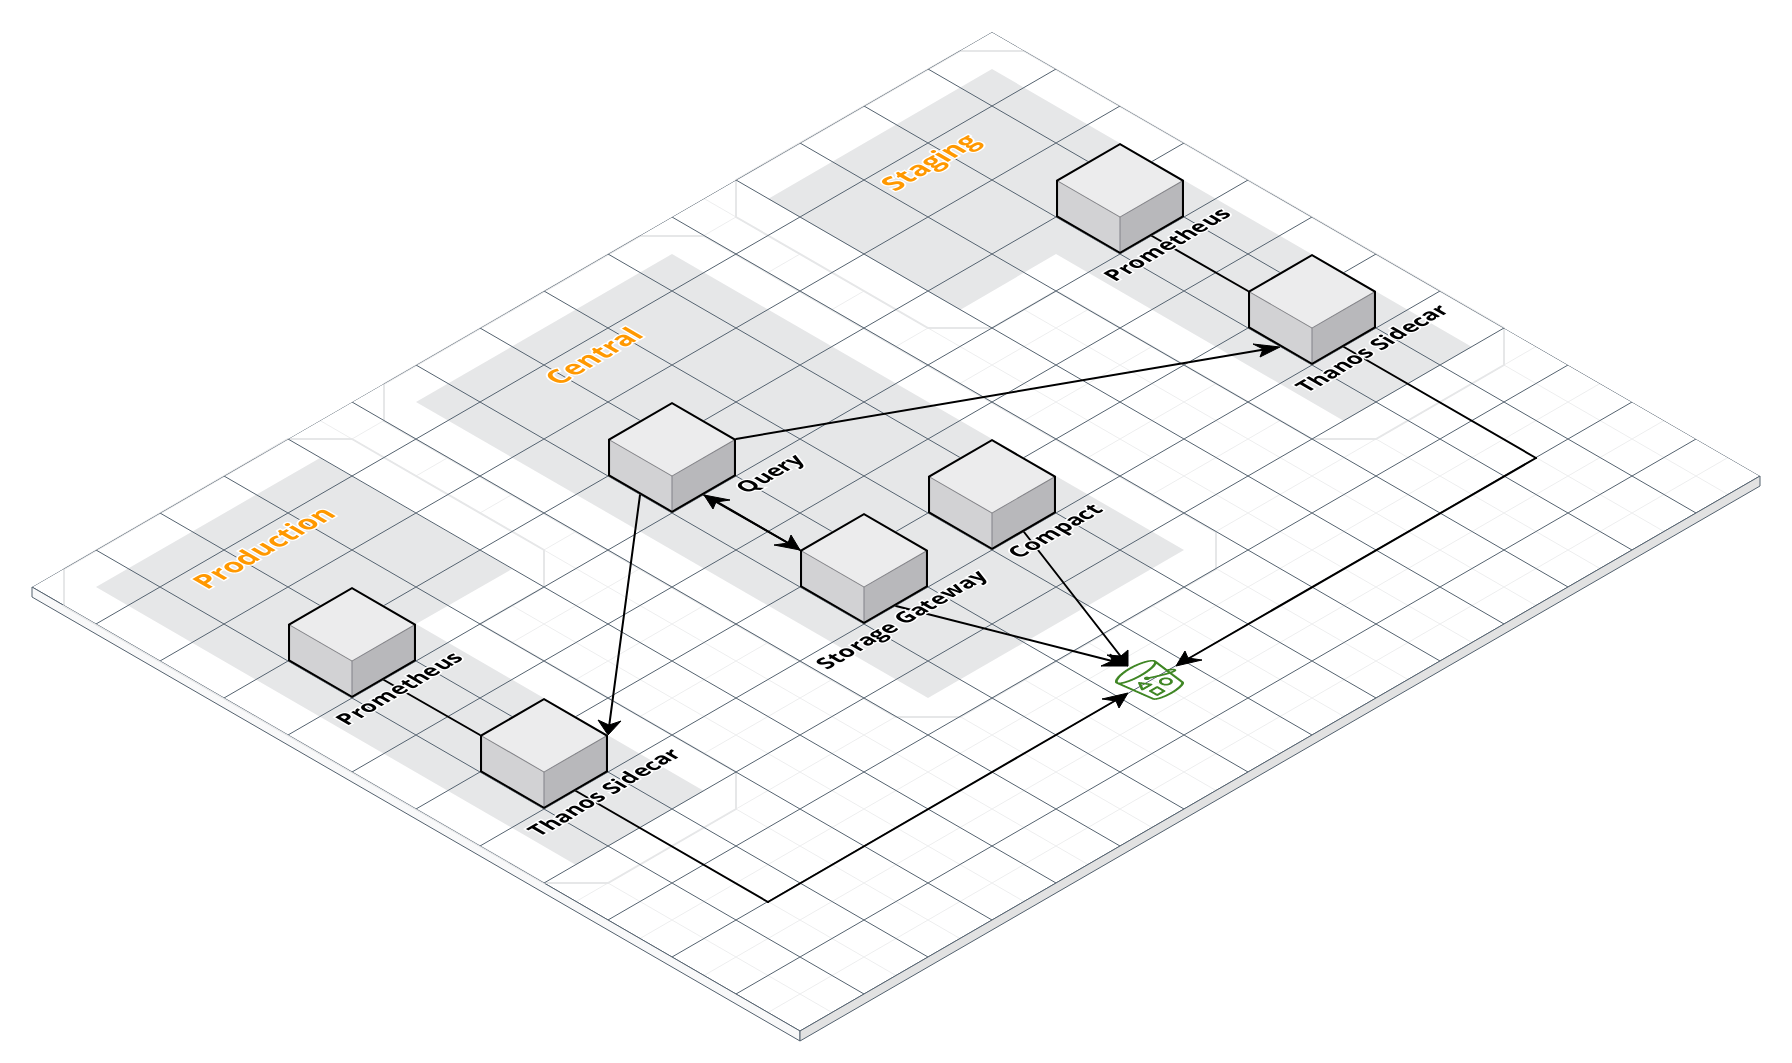
In this infra, we have 2 clusters running their own Prometheus with a Thanos sidecar. This cluster setup can be like:
- A Kubernetes pod with Prometheus and Thanos containers.
- A Docker compose with services for Prometheus and Thanos.
- A linux host with separate systemd services for Prometheus and Thanos.
You can be as creative as you want. I set these 2 clusters with a Bitnami helm chart (kube-prometheus) with the following values:
prometheus:
  serviceAccount:
    annotations:
      eks.amazonaws.com/role-arn: arn:aws:iam::123456789012:role/ThanosS3Access
  disableCompaction: true
  externalLabels:
    cluster: production # Change it to staging for 2nd cluster
  thanos:
    create: true
    objectStorageConfig:
      secretName: thanos-objstore-config
secretKey: thanos.yamlexternalLabels need to be unique for every Prometheus cluster. This helps Thanos distinguish between the chunks.Create the secret for thanos with S3 bucket configuration:
apiVersion: v1
kind: Secret
metadata:
  name: thanos-objstore-config
  namespace: monitoring
type: Opaque
stringData:
  thanos.yaml: |
    type: s3
    config:
      bucket: some-bucket # create the bucket before deployment
      endpoint: s3.ap-south-1.amazonaws.com # any S3 compatible service endpoint will work
      aws_sdk_auth: true
Setup: Thanos Components
Next we need to setup the following Thanos components:
- Compact: A component to downsample the Prometheus chunks in S3, delete the chunks older than retention specified and run compaction.
- Storage Gateway: A component to offload all the interactions with object storage being used. This decouples other Thanos components from underlying storage.
- Query: A component that provides the Prometheus query API on top of the chunks. The chunks are fetched from sidecars directly or through the storage gateway based on the start/end time in the Prometheus query.
Again, you can use various methods to deploy these components as ther Prometheus setup. I used the Bitnami one (thanos) again with these values:
existingObjstoreSecret: thanos-objstore-config
existingObjstoreSecretItems:
  - path: objstore.yml
    key: thanos.yaml
query:
  enabled: true
  dnsDiscovery:
    sidecarsService: prom-op-kube-prometheus-prometheus-thanos
    sidecarsNamespace: monitoring
  extraFlags:
    - --endpoint=10.X.Y.Z:10901 # Production prometheus
    - --endpoint=10.X.Y.Z:10901 # Staging prometheus
  serviceAccount:
    annotations:
      eks.amazonaws.com/role-arn: arn:aws:iam::123456789012:role/ThanosS3Access
queryFrontend:
  enabled: false
bucketweb:
  enabled: false
compactor:
  enabled: true
  retentionResolutionRaw: 30d
  retentionResolution5m: 90d
  retentionResolution1h: 180d
  consistencyDelay: 30m
  serviceAccount:
    annotations:
      eks.amazonaws.com/role-arn: arn:aws:iam::123456789012:role/ThanosS3Access
storegateway:
  enabled: true
  sharded:
    enabled: true
    timePartitioning:
      # One store for data older than 6 weeks
      - min: ""
        max: -6w

      # One store for data newer than 6 weeks and older than 2 weeks
      - min: -6w
        max: -2w

      # One store for data newer than 2 weeks
      - min: -2w
        max: ""
  serviceAccount:
    annotations:
      eks.amazonaws.com/role-arn: arn:aws:iam::123456789012:role/ThanosS3Access
I have taken some recommendations from this awesome blog. Do give it a read.
Few points to note here:
query.dnsDiscoveryworks for Prometheus sidecar service deployed in the same cluster. To connect to different cluster sidecar use either a hostname/IP that is reachable from this cluster. You may need to do peering if the clusters are in different VPCs.- The
--endpointflag inextraFlagscan be used if you do not want to use in build DNS discovery mechanism of Thanos. Again the hostname/IP must be reachable. - The contents of the secret
thanos-objstore-configare the same as before.
Visualization
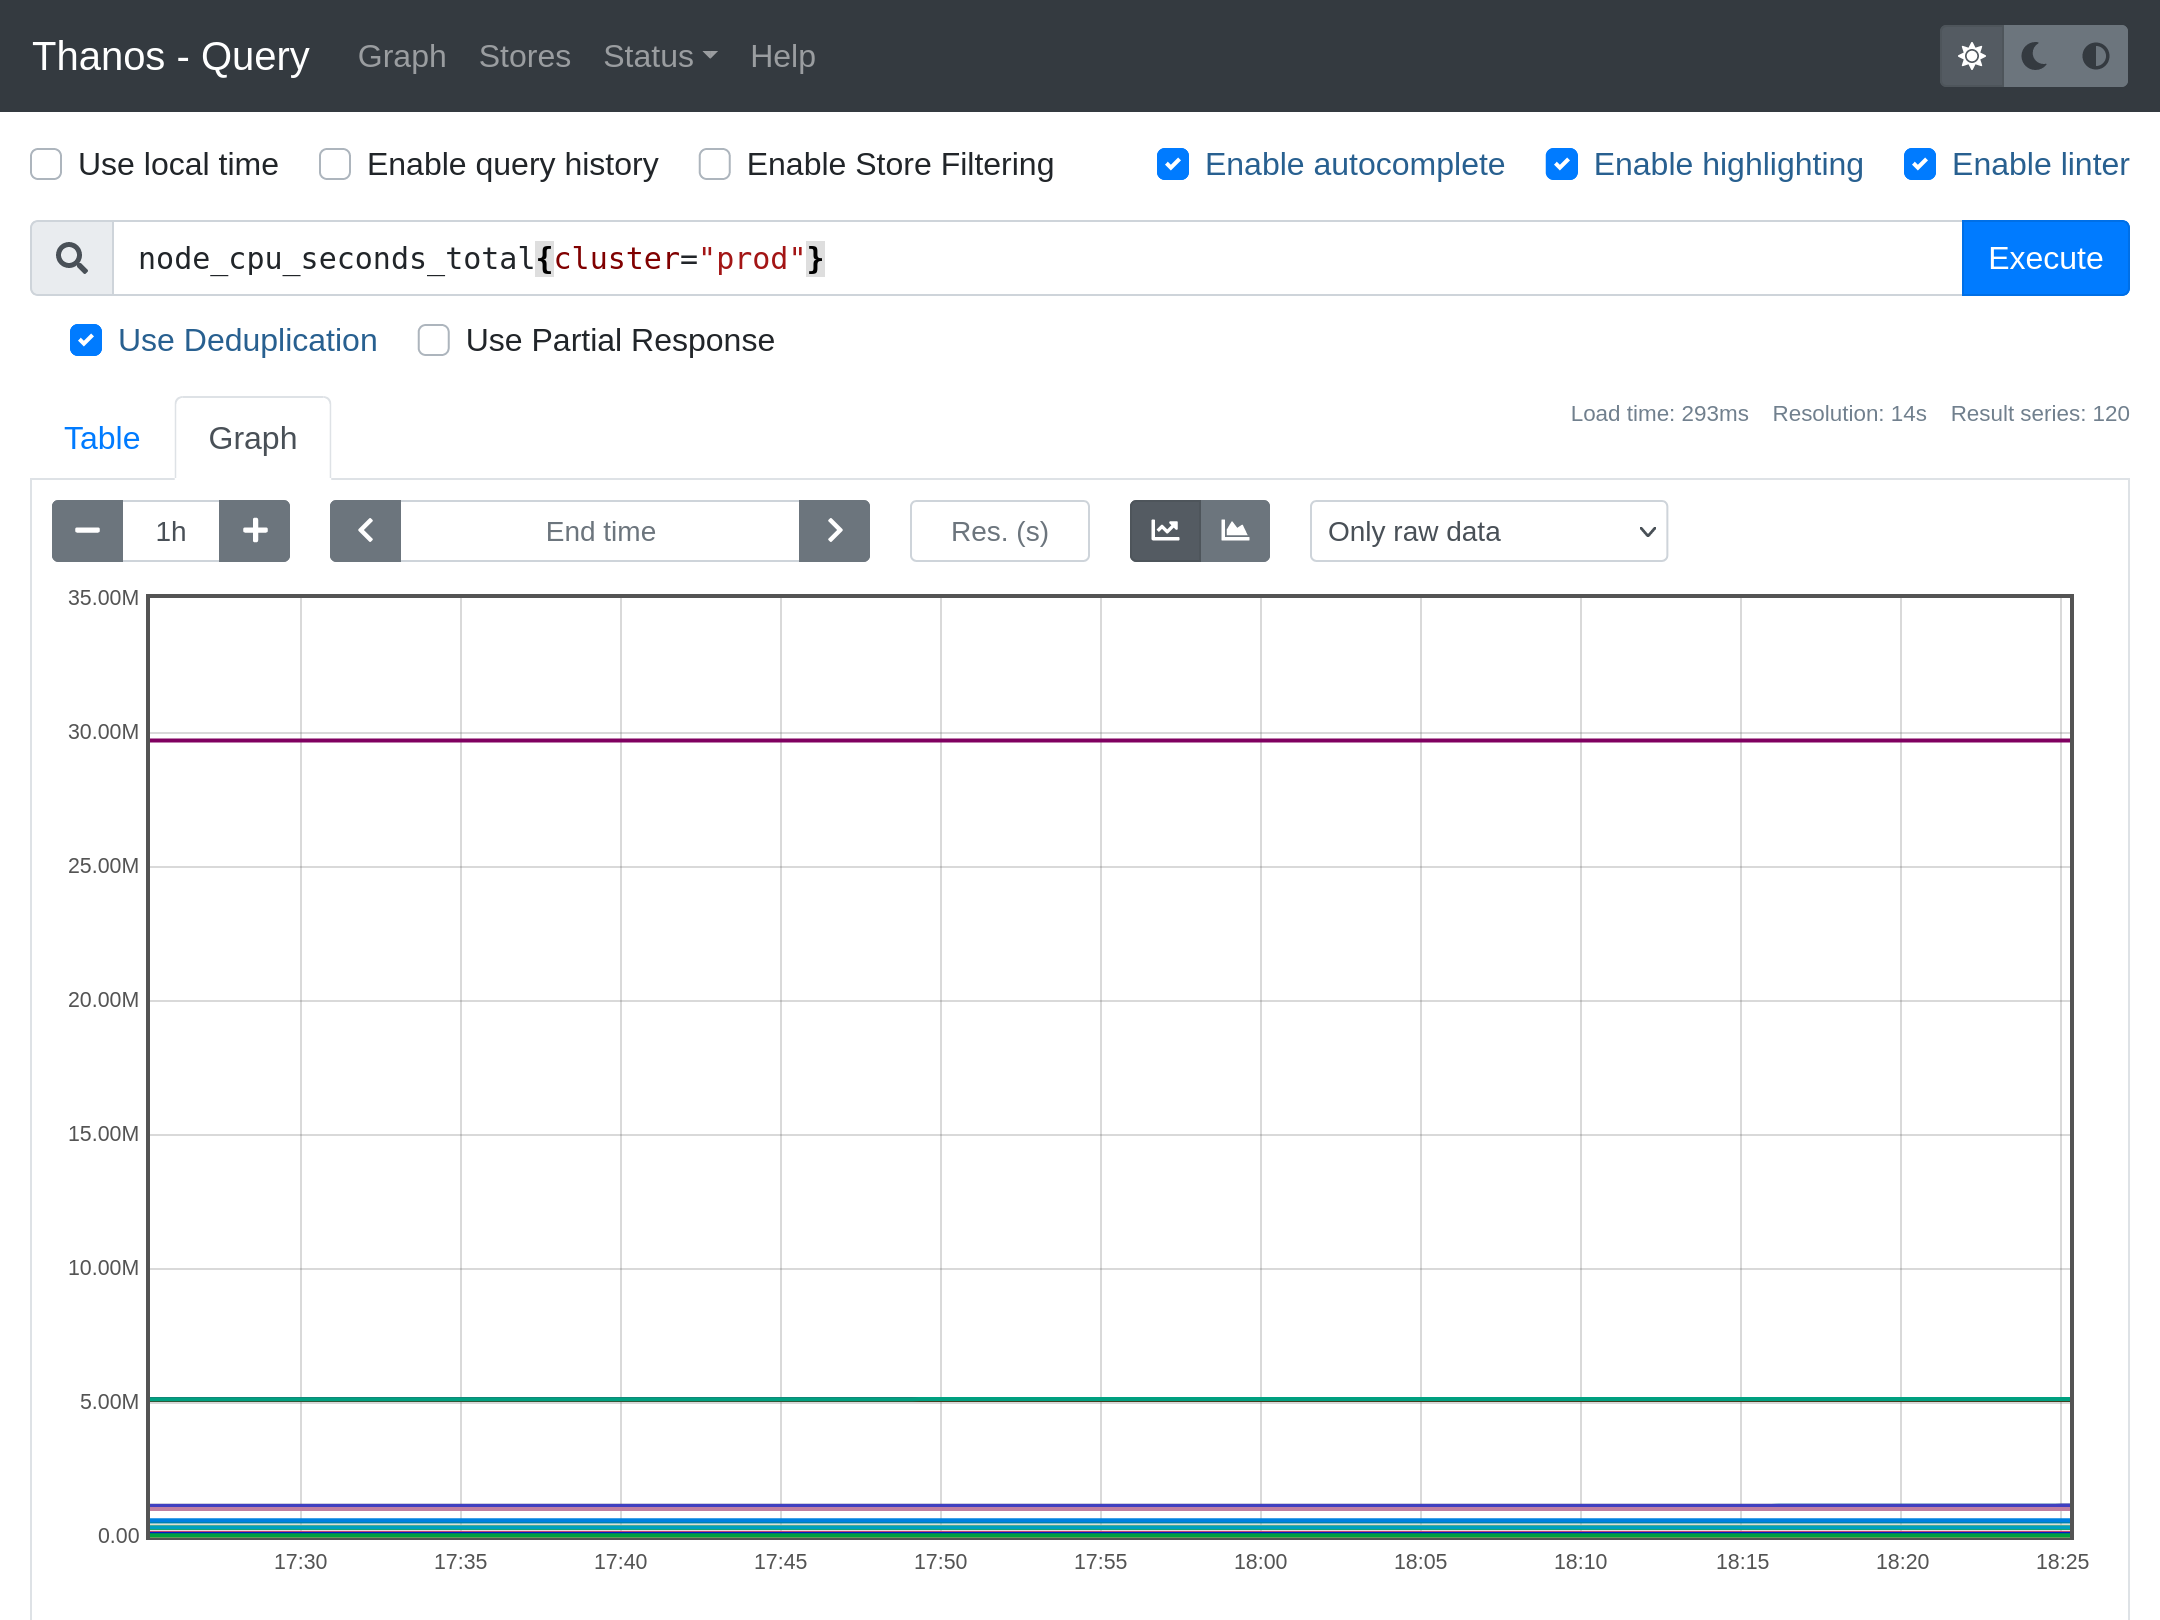
At this point you will have a working multi-cluster Thanos setup, fetching and storing metrics from all across your Prometheus servers. You can connect to Thanos Query service on 9090 port by forwarding:
kubectl -n monitoring port-forward services/thanos-query 9090:9090When you open http://localhost:9090, you will see a very familiar Prometheus like UI.
Why stop here? Thanos Query boasts of an API compatible with Prometheus. So we can go ahead and add it as a Prometheus datasource in Grafana. In the "Type and version" section choose Thanos.
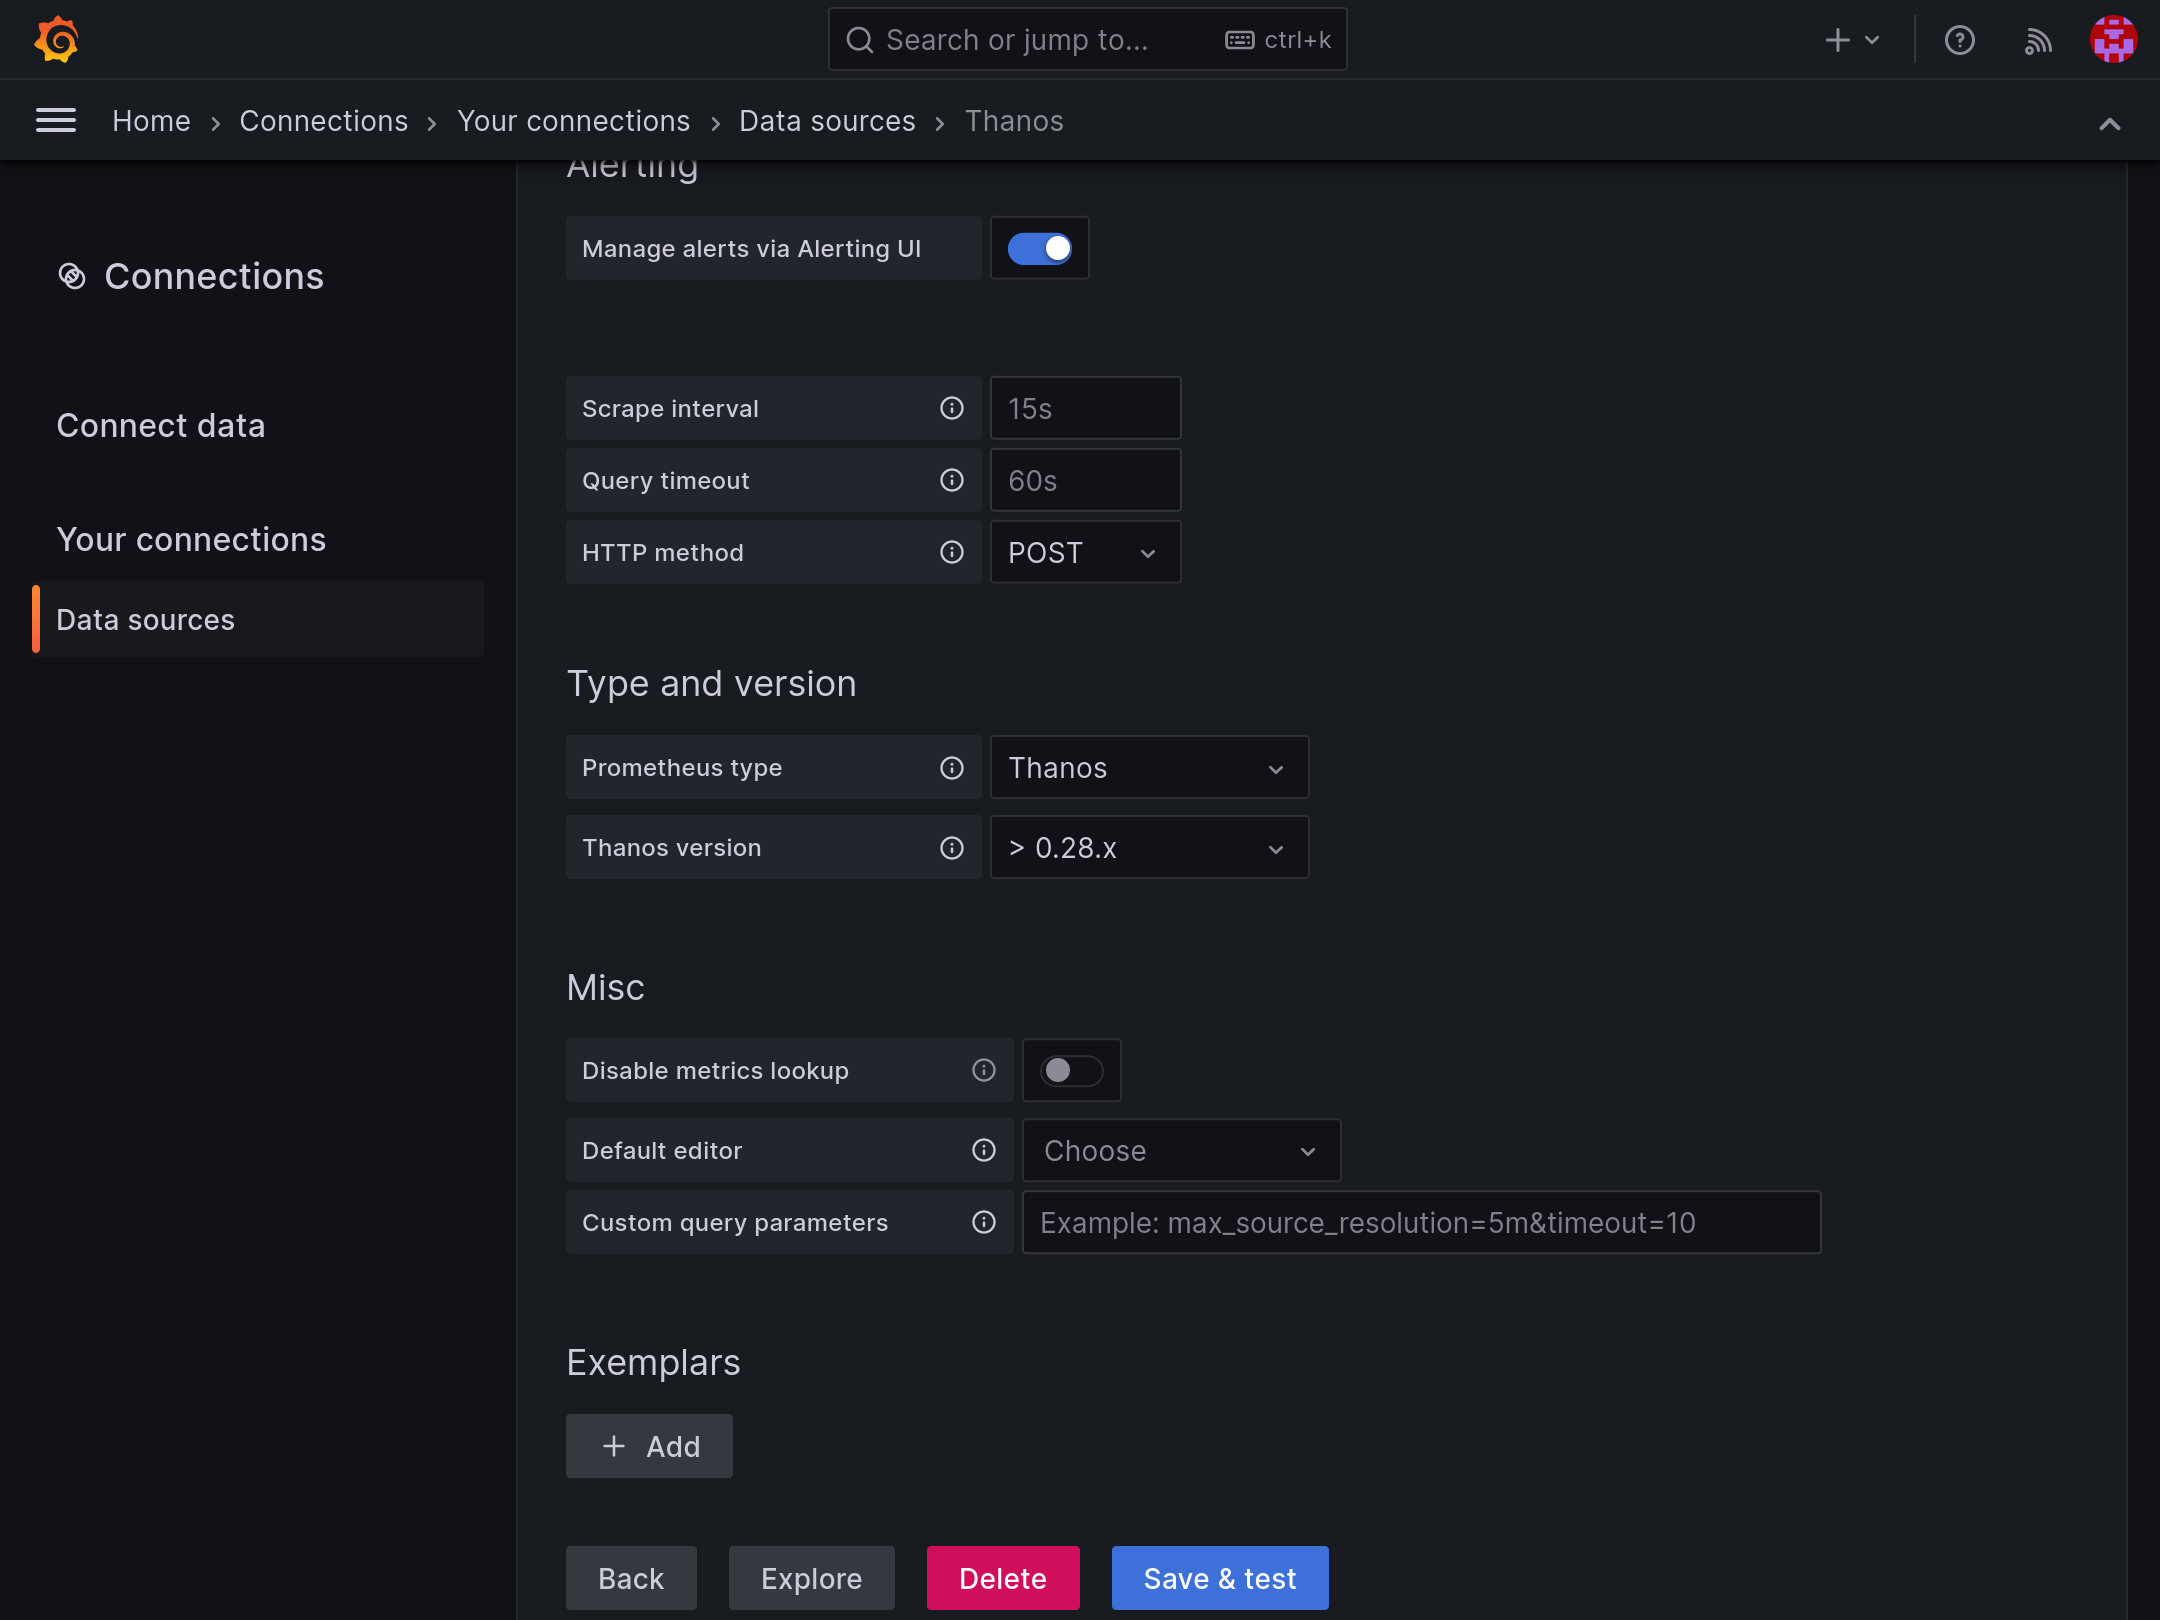
You can use it in existing Prometheus based dashboards or create new ones.
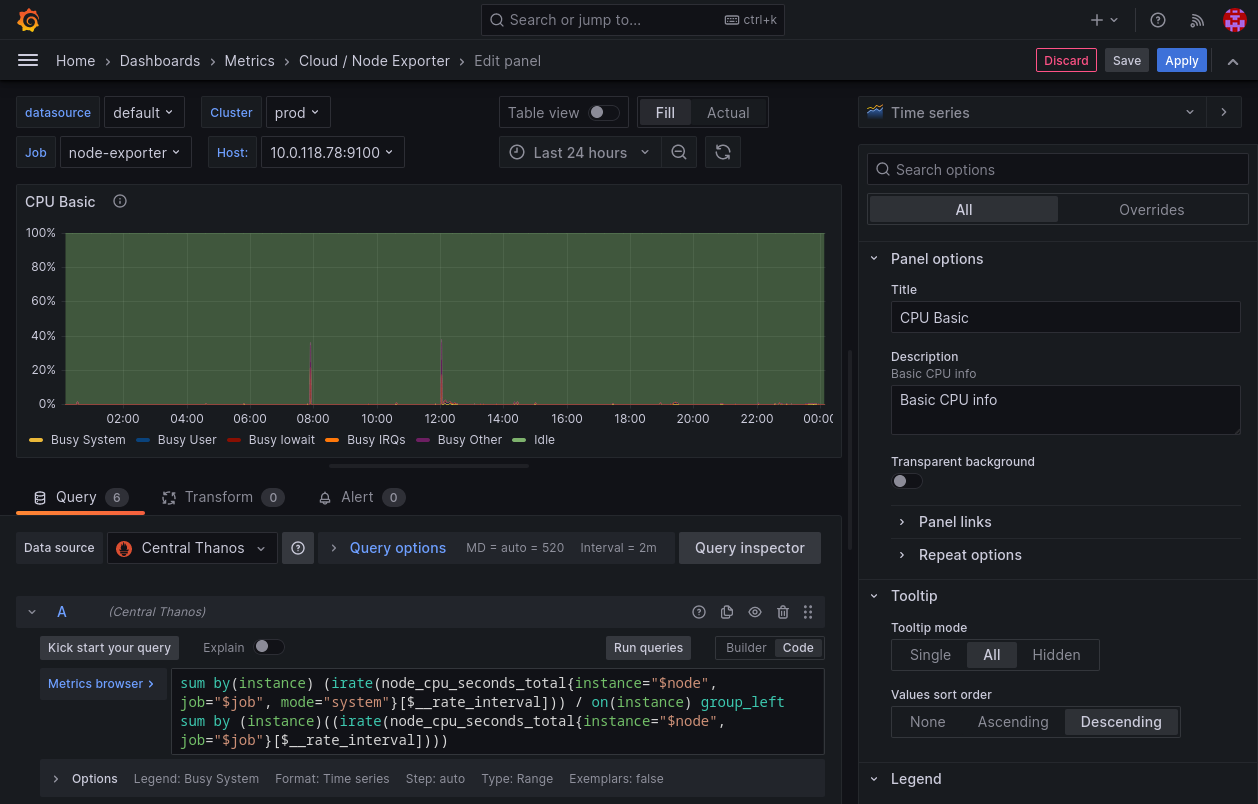
cluster. This is from the externalLabel that we added to every Prometheus in different clusters.Wrapping Up
This has been a long post. Multi-cluster observability is a modern infra necessity. Thanos can not just helps with that but it also helps with long term metric retention. This can required for compliance purposes or just to measure the infra trend through past months. Hope you found what you were looking for in this post.